Pleaz Power BI Dashboards
While working at Pleaz, I developed a series of Power BI dashboards that enabled teams across the organization to track key metrics.
Overview & My Role
I created PowerBI dashboards that visualized business and product metrics tailored to the needs of different teams. This involved working closely with stakeholders to define questions, shaping KPIs, and iterating on clear, accessible visualizations.
- My role: requirements gathering, data modeling, dashboard design, roll-out & support
- Impact: clearer view of adoption and usage patterns, faster identification of at-risk accounts, and better prioritization for content
Methods & Tools
- Power BI (data model, DAX, visuals)
- SQL/ETL for data preparation
- Stakeholder workshops to define KPIs
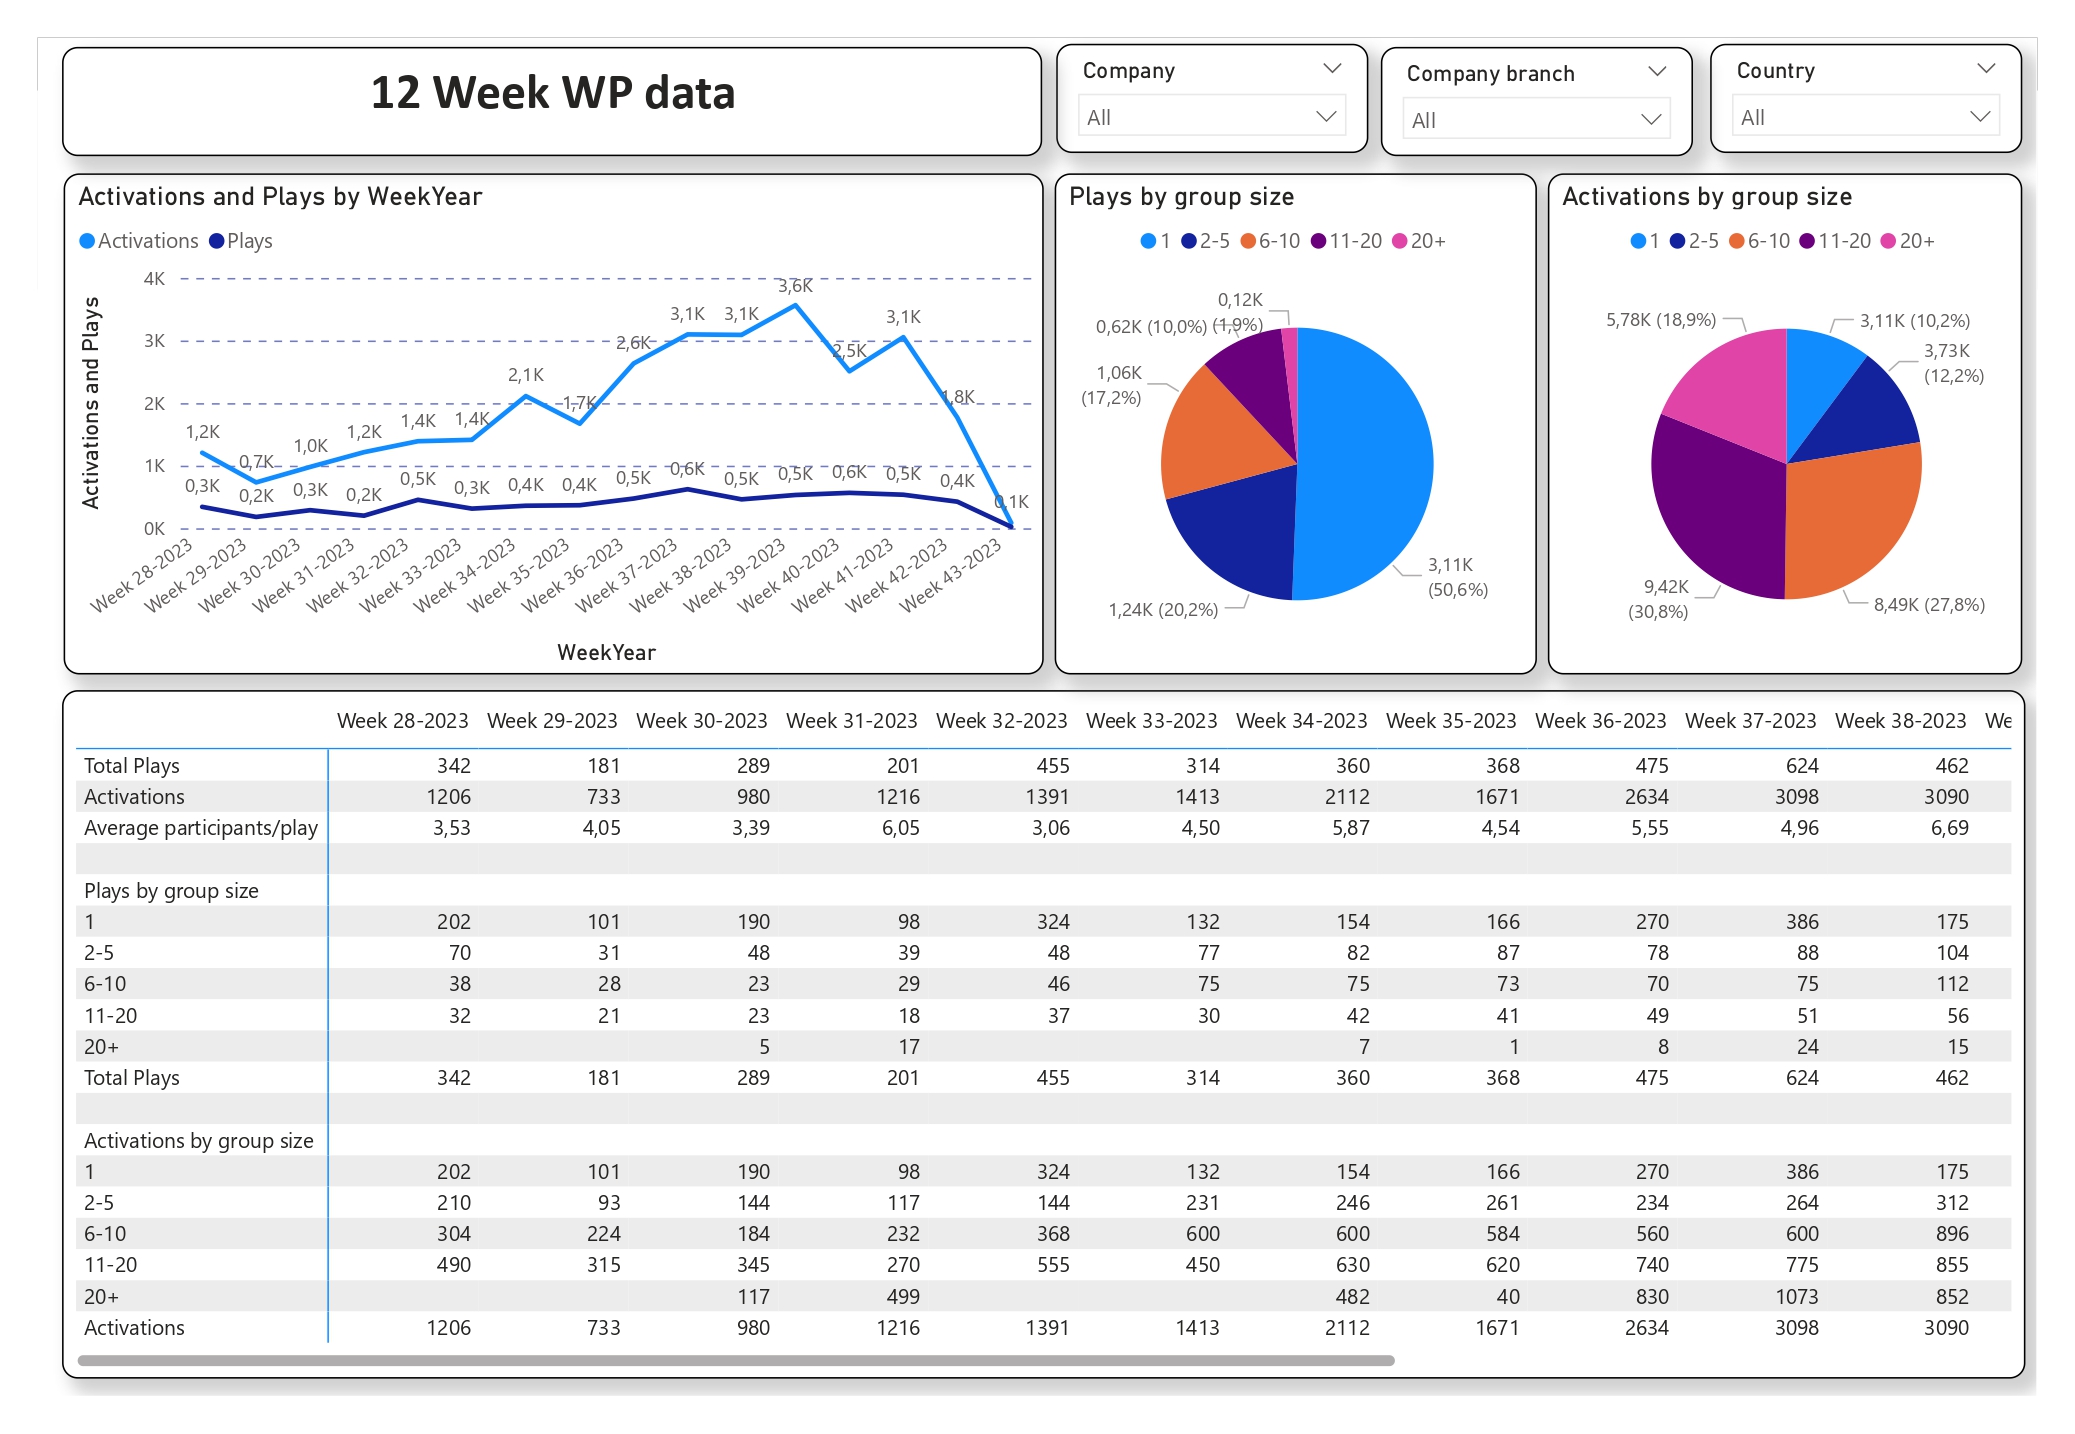
Product Usage Dashboard (Management, Content & Customer Success)
Designed for management, content, and customer success teams, this dashboard tracked weekly activations and customer usage. It helped leadership monitor adoption trends, enabled customer success to focus their outreach, and gave the content team insights into which types of videos were most watched.
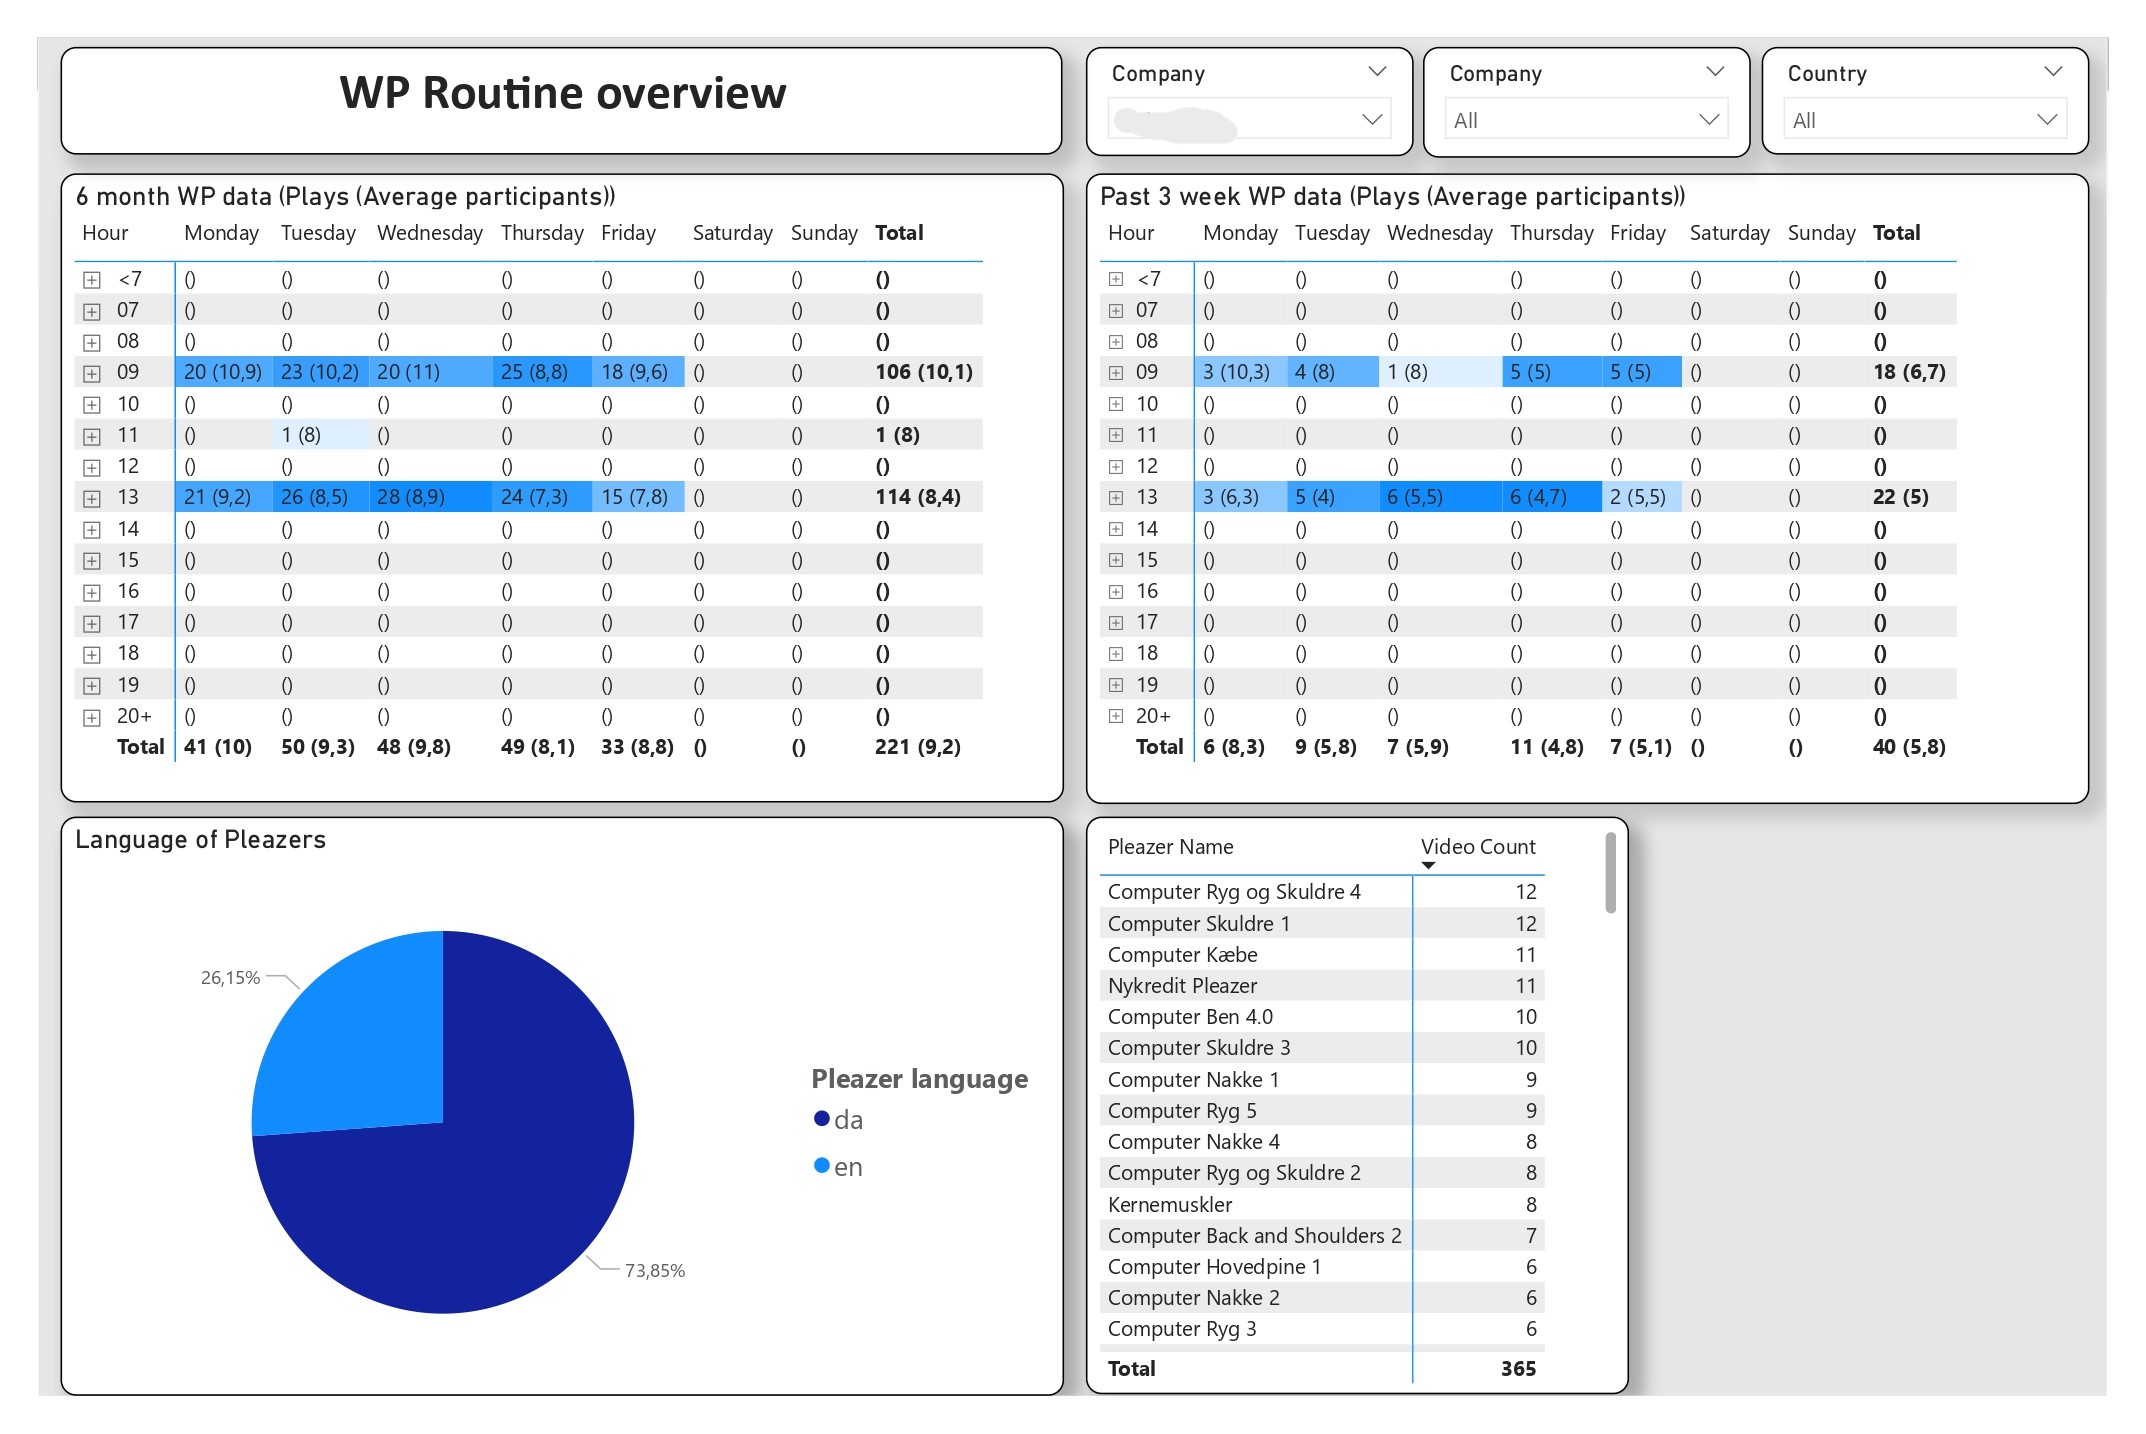
Routine Dashboard (Customer Success)
Helping customers establish a routine was the top priority for the Customer Success team. This dashboard showed time-of-day usage patterns, giving them a daily tool to track when clients engaged with the platform and guide them toward building stronger routines.
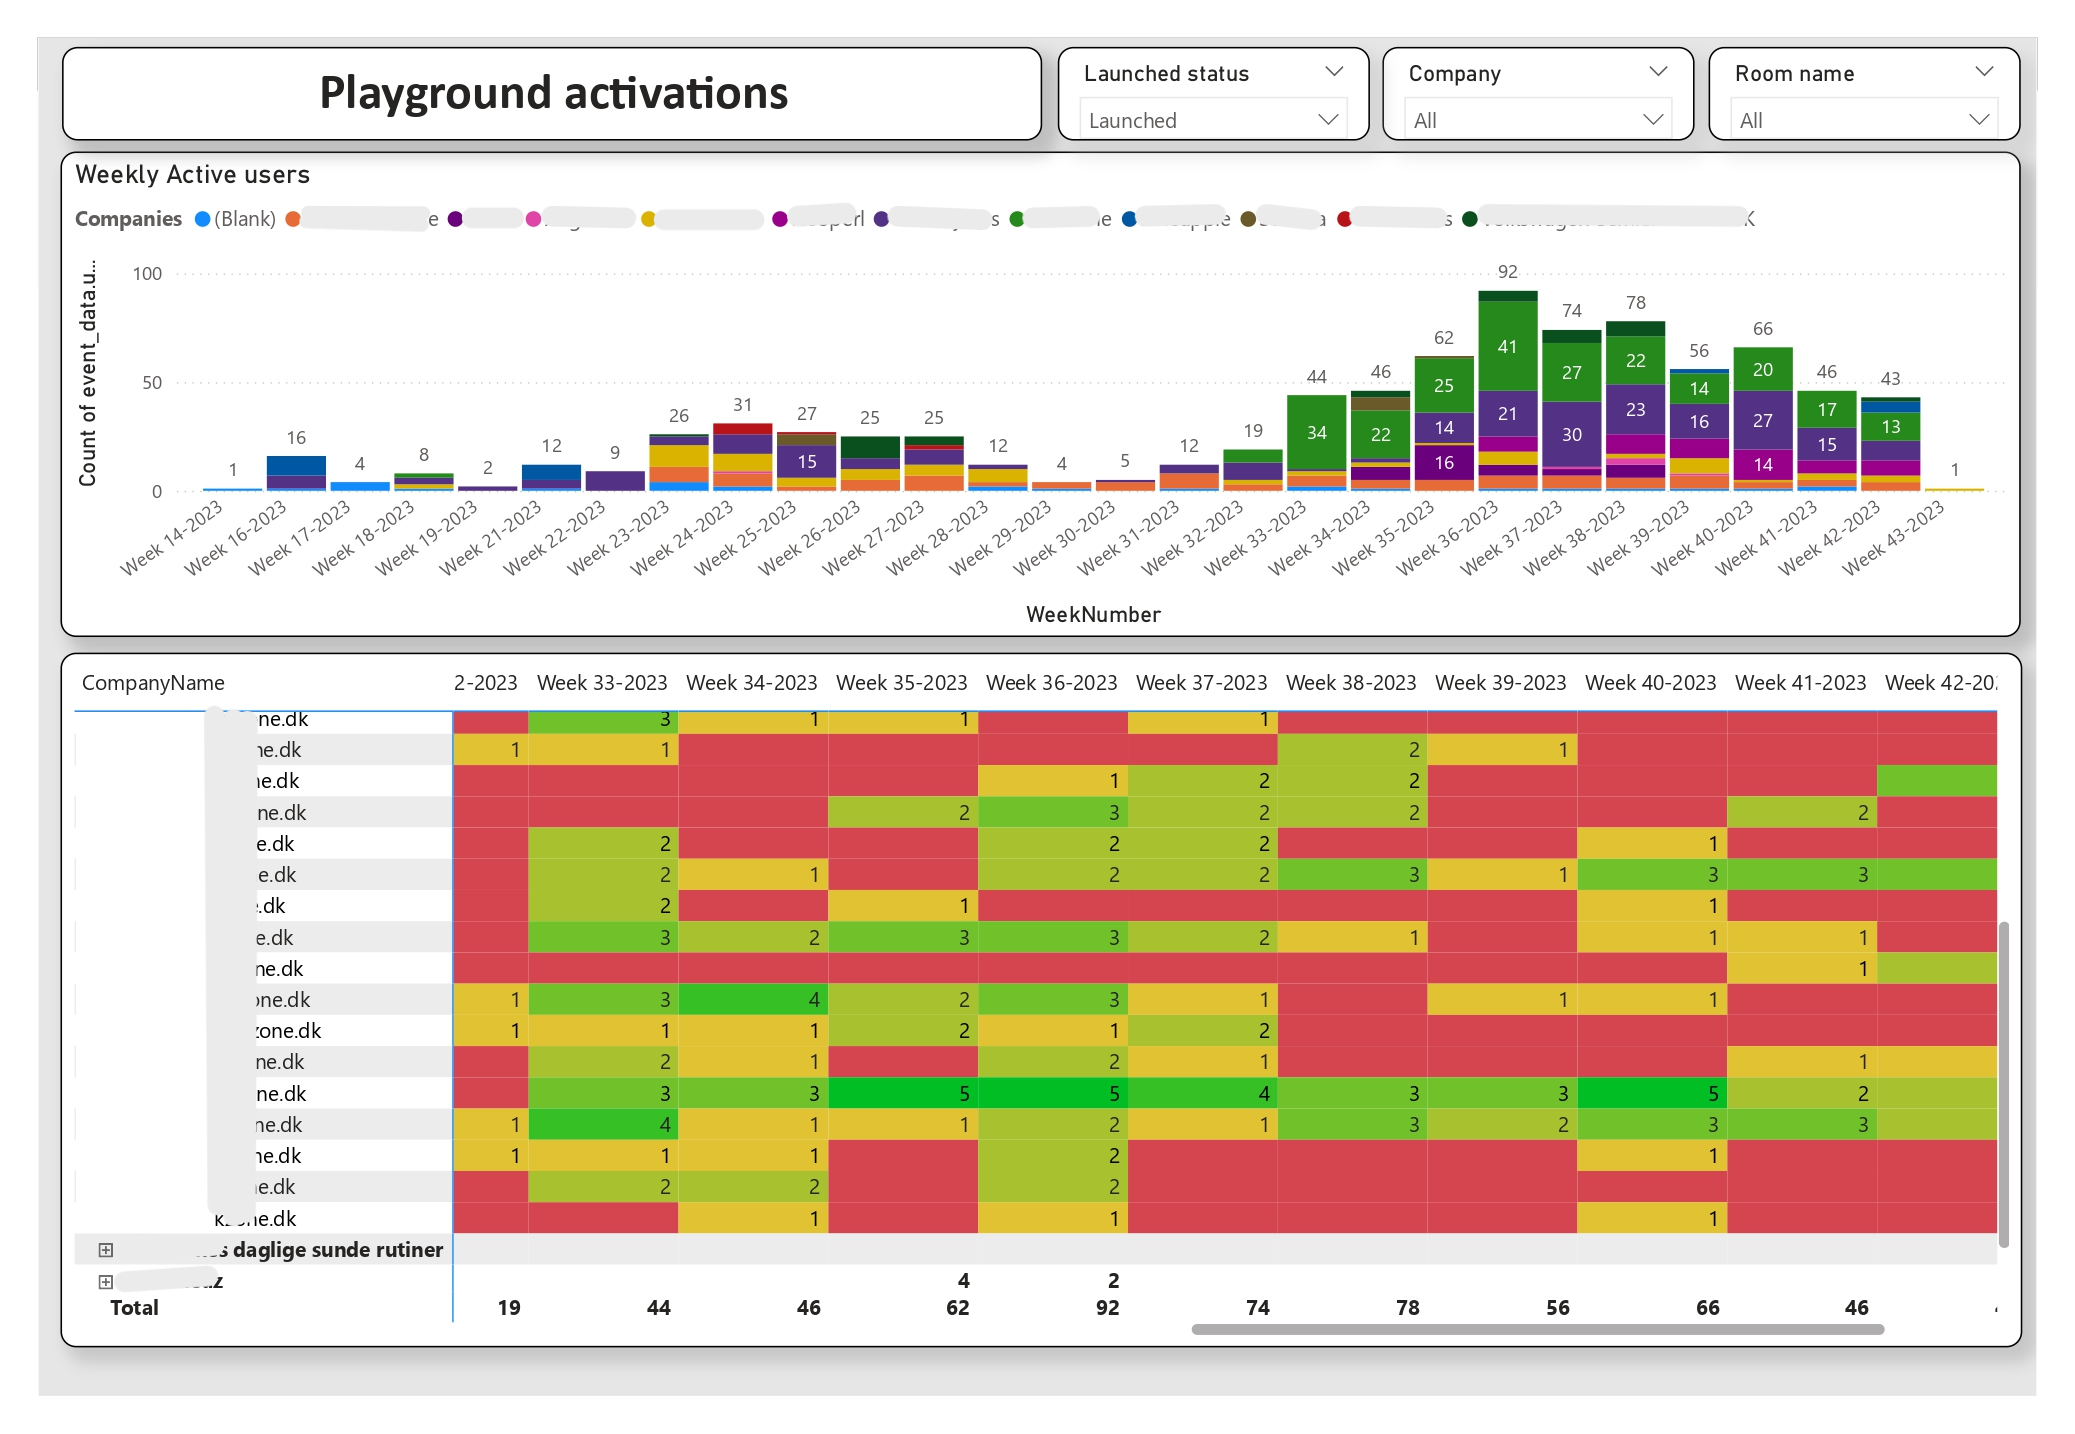
New Product Adoption (Management, Product & Customer Success)
Built to monitor the rollout of a new product, this dashboard tracked weekly active users and adoption at the team level. It gave management visibility on performance, helped customer success and sales teams identify engaged accounts, and supported the product team as they iterated on the launch.